Visual reports are quickly and easily interpreted. We can create “interactive dashboards” which allow our clients to view their market research data on the fly. We are able to create powerful, dynamic, easy-to-interpret dashboards that give a summary view of results; ideal for supporting business presentations and sharing results with clients, colleagues, and stakeholders.

Dashboard Reporting
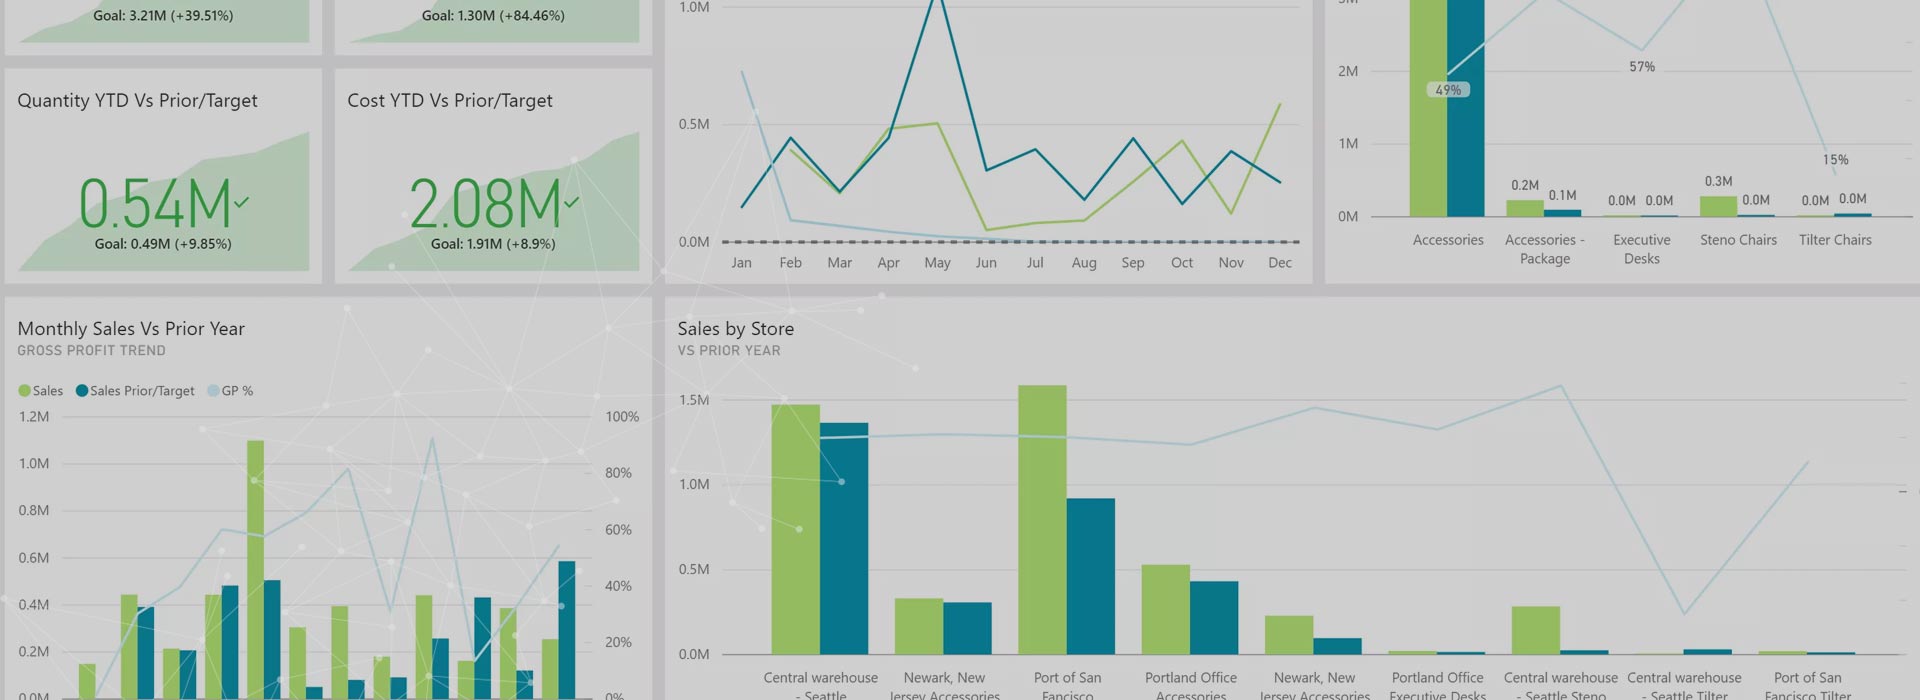
Dashboard Reporting for Market Research made easy by IDS Research & Consultancy. Find the best business intelligence dashboards, analysis and reporting that needs for your projects.
 Business Intelligence Dashboards:
- Shared Parameters: Users can specify filter parameters with various layouts on the dashboard. These parameters can be shared among elements on the dashboard to provide uniform ranges of the KPIs at run-time.
- Unlimited Drill-down: To see detailed information about certain data point, users can drill-down to a chart, report, map, etc . There is no limit as to how far deep one can drill-down to and how many points to drill from.
- Element Linking: Clicking on a data point in one element will propagate the value to other elements on the dashboard. In effect, the affected elements on the same dashboard are refreshed with parameter value fed from the data point clicked.
- Space Efficient Folders: Put a group of reports and charts in a “folder” on the dashboard so more information can be packed in a dashboard real-time
- Refresh: Users can set up automatic refresh time interval for refreshing of data in the dashboard.
- Slide Show: A group of dashboards can be run as slide shows for customized data monitoring or professional presentations.
- Flexible Formats: Display dashboard charts in either static images for universal compatibility or in animated flash for added visual appeal.